
A Profit and Loss (P&L) statement, also known as an income statement, is a financial document that summarizes a company's revenues, costs, and expenses over a specific period of time.
For a food business, a P&L statement is critical for understanding its financial health, as it provides an overview of the company's profitability and operating efficiency. By analyzing the P&L statement, you can assess your business' revenue streams, identify cost drivers, and make informed decisions about pricing, inventory management, and operational strategies. In short, a P&L statement is an essential tool for monitoring the financial performance of your business. In this knowledge article, we will take a look at how to organize your P&L with a chart of accounts, an example, and more details on the various categories.
Chart of Accounts
In the context of a profit and loss statement, a chart of accounts is a listing of all the accounts and categories used to organize financial transactions in your food business. It provides a systematic way to track and categorize financial transactions. You can read more on this topic here.
Below is a sample Chart of Accounts for a CPG food business:
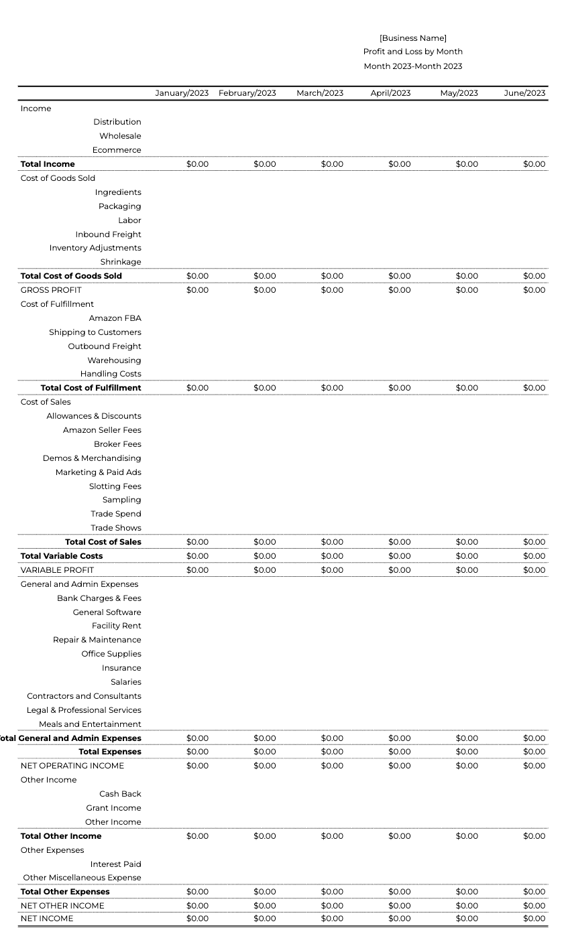
As you can see, it is organized into:
- Income: The money coming into your business
- Cost of Goods Sold: Costs required to physically make each unit of your product
- Variable Costs: Variable costs that increase or decrease based on the amount you produce and sale. These include Cost of Fulfillment (getting the product to consumers) and Cost of Sales (selling the product to consumers).
- Expenses: These are your fixed costs that do not change based on the amount you produce.
- Other Income: Any income that is not generated from your core operations or sales (non-product related sales)
- Other Expenses: Any expenses that are not included in the primary expense categories, usually miscellaneous expenses
Income
The income section of your P&L statement includes the revenue generated from selling your products. The three primary categories for this section include:
- Distribution: Sales from selling your product to a distributor
- Wholesales: Sales directly from you to a retailer
- E-commerce: Sales generated online either through your website or a third party platform
- Food Service: You may also want to include food service if this is part of your core business model
Cost of Goods Sold - No Higher than 65%
Cost of Goods Sold (COGs) are the materials and labor required to create a finished product. Your COGs should be between 40 to 65 percent of your sales. 65% is the bare minimum. This is the inverse of your gross margin. (COGS / Sales)*100 = COGs %
- Ingredients
- Packaging
- Labor
- Inbound Freight
- Inventory Adjustments (*update monthly based on your inventory count)
- Shrinkage
Read more on your financial goals here.
Gross Profit (or Gross Margin)
Your gross profit is calculated by subtracting your COGs from your income.
To calculate the percentage gross margin, divide your total COGs from your income. Your goal for your gross margin is 35 to 55 percent.
100% - COGs % = Gross Margin
Variable Costs (Cost of Fulfillment and Cost of Sales)
Packaged good companies have two other sets of variable costs in addition to cost of goods. These are not costs directly related to manufacturing the product but do change based on how much you make and sell. These are: Cost of Fulfillment and Cost of Sales.
Cost of Fulfillment - No Higher than 5%
Cost of Fulfillment represents the costs of moving finished product to the customer. It should be 5 percent.
Cost of Sales - No Higher than 20%
Cost of Sales are the costs related to selling the finished product. Your Cost of Sales should be no higher than 20% of your sales.
Read more on Cost of Sales here.
Variable Margin (or Variable Profit)
Variable margin is calculated by subtracting your cost of fulfillment, cost of sales, and cost of goods from your income.
To calculate the variable percentage, divide the total of your variable costs by your income.
General & Administrative (G&A)
General and Administrative (G&A) expenses refer to the costs that a business incurs to support its overall operations and management. These expenses are typically fixed, meaning they do not vary with changes in production or sales levels.
Some common examples of G&A expenses include rent, salaries and wages of administrative staff, accounting and legal fees, office supplies and equipment, insurance premiums, bank fees, and taxes. These expenses are essential for a business to run smoothly and efficiently, but they do not directly contribute to the production of goods or services that generate revenue.
Net Operating Income
Net operating income is calculated by subtracting your variable costs and operating expenses (General & Administrative or non-variable expenses) from your revenue.